
Find out which half of the fleet pays for itself
Utilisation per object, revenue by category and location, and a season you can look back at rather than remember.
No monthly subscription to start: two plans lower your costs as you grow.
What reporting shows
Reporting covers revenue, bookings and utilisation, broken down by object, category, location and period. The question it exists to answer is which parts of your fleet earn their keep and which sit in the shed being insured.
Rental businesses tend to buy more of whatever they remember running out of. That memory is unreliable: it is weighted towards the one weekend somebody complained, not towards the pattern across the season.
Utilisation per object replaces that with evidence. It usually shows two things: a group of objects that were booked almost every day and quietly capped your revenue, and a group that barely moved and are costing you storage and capital.
The reports that matter
- Utilisation per object and per category, across any period.
- Revenue by object, category, location and hire length.
- Demand against stock, including the sizes and categories that ran out.
- Booking sources, so you can see what your own site brings versus other channels.
- Deposits held, released and settled, and what damage actually cost you.
- Promotion performance measured in margin, not in codes redeemed.
- Season-over-season comparison, which is the only comparison that means anything in rental.
- Exports for your accountant or your own BI tooling.
Where the money actually came from
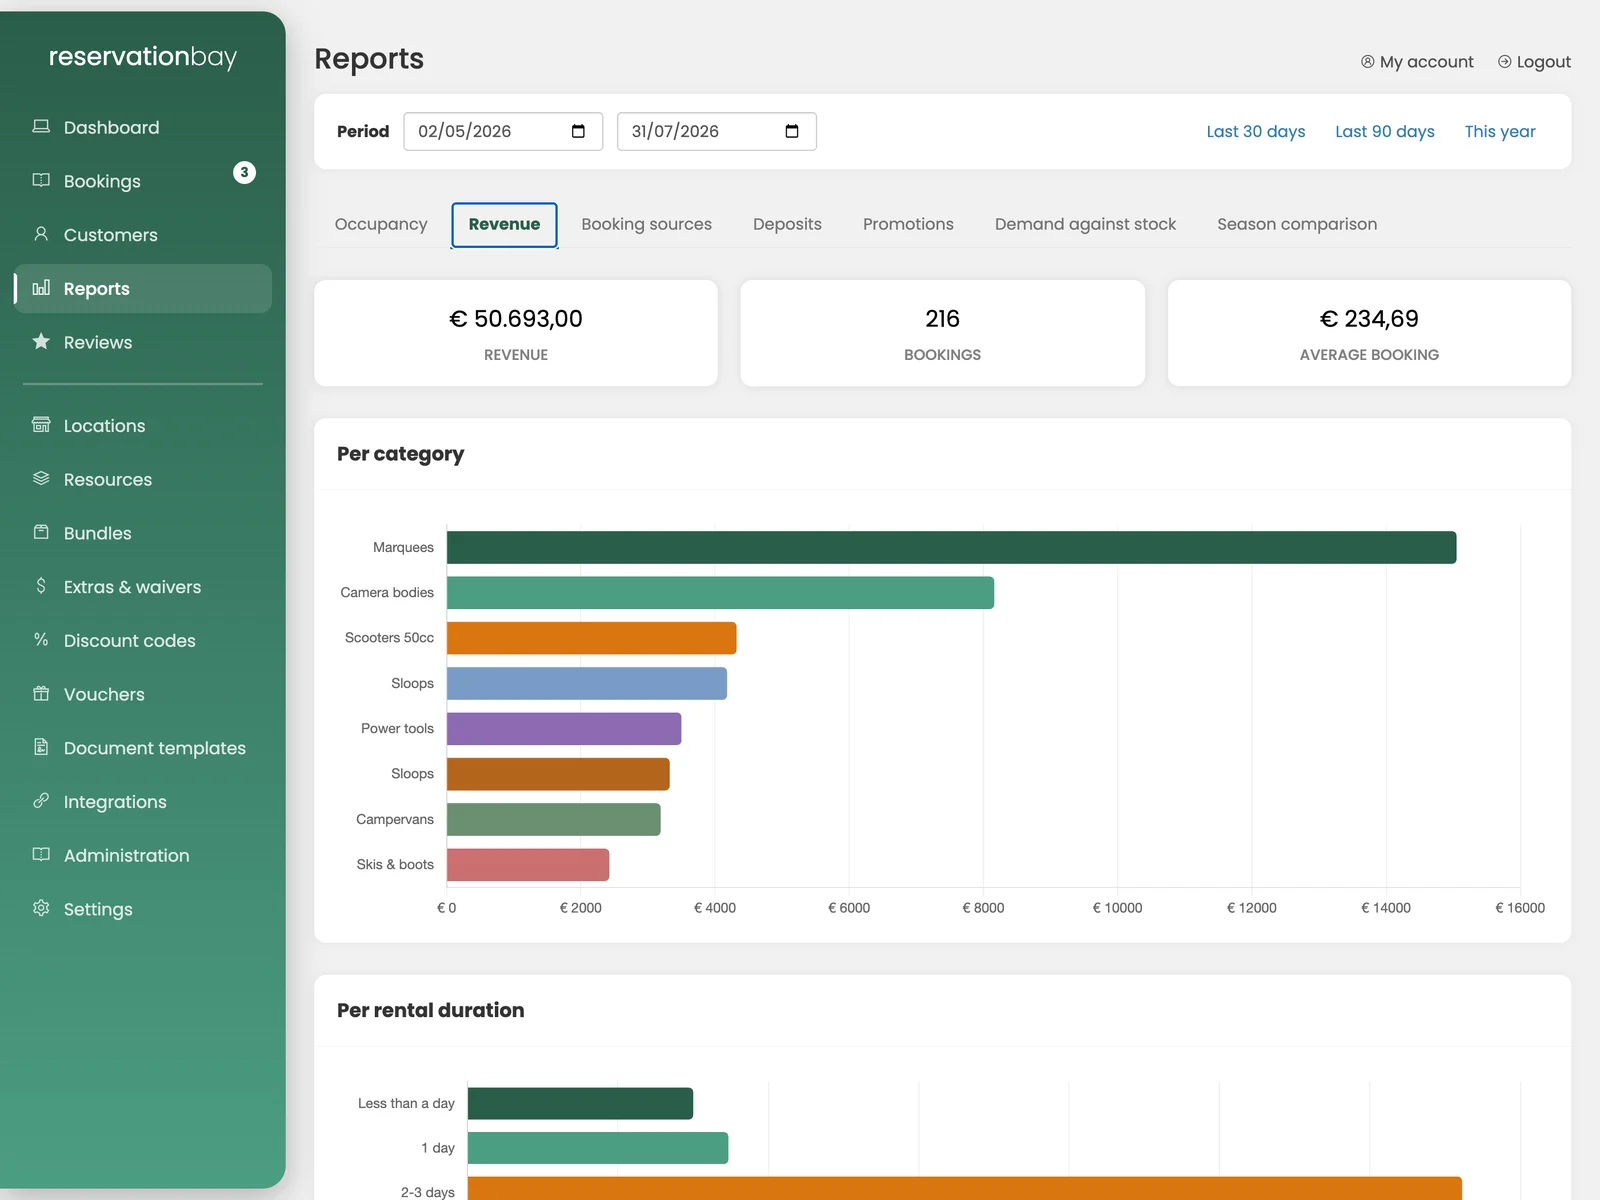
Revenue split by category and by how long things went out for, over a period you choose. Occupancy, booking sources, deposits and a season comparison sit beside it as their own tabs.
Every tab exports to CSV, so the figures you go through with your accountant leave the platform in the shape they were in.
What reporting connects to
Frequently asked questions
What is the most useful report?
Utilisation per object, almost always. It tells you which objects were booked nearly every day and therefore capped your revenue, and which barely moved and are costing you capital and storage.
Can I see demand I could not meet?
Yes. Demand against stock shows where availability ran out, which is the difference between "we were busy" and "we turned away eleven bookings for large wetsuits".
Can I compare this season to last?
Yes, and it is the only comparison worth much in a seasonal business. Month against month tells you about the weather, not the business.
Can I export the data?
Yes. Exports are available for your accountant or your own BI tooling, and your data remains yours to take.
Is reporting available on the free package?
The operational reporting is. Deeper multi-location reporting and BI exports come with the higher packages.
Look at the season honestly
Create a free account and start building the record. The first full season is when reporting begins to pay.